个人手记 · 经济与生活
中国经济走到哪一步,普通人该怎么安排生活
经济还在增长,为什么有人觉得钱更难赚?从最新数据出发,聊聊工资、房贷、现金流与小生意,也给不同的生活经验留个位置。
看完,聊两句增长还在,感受却不相同
谈中国经济,很容易遇到两种说法:一边是生产、出口和新产业的增长,另一边是求职、经营和家庭开支的压力。它们可以同时存在。一个家庭的感受,取决于收入来自哪里、负债有多重,以及手里的资产能否变成可用的钱。本文把截至2026年11月16日可核实的数据放在一起,再回到普通人的生活安排。
前三季度,GDP按不变价同比增长4.6%;一、二、三季度分别增长5.0%、4.3%、4.5%。总量仍在扩大,但GDP统计的是经济增加值,不能据此判断某个行业工资、某家店利润或某个家庭收入也增长了同样幅度。[1]
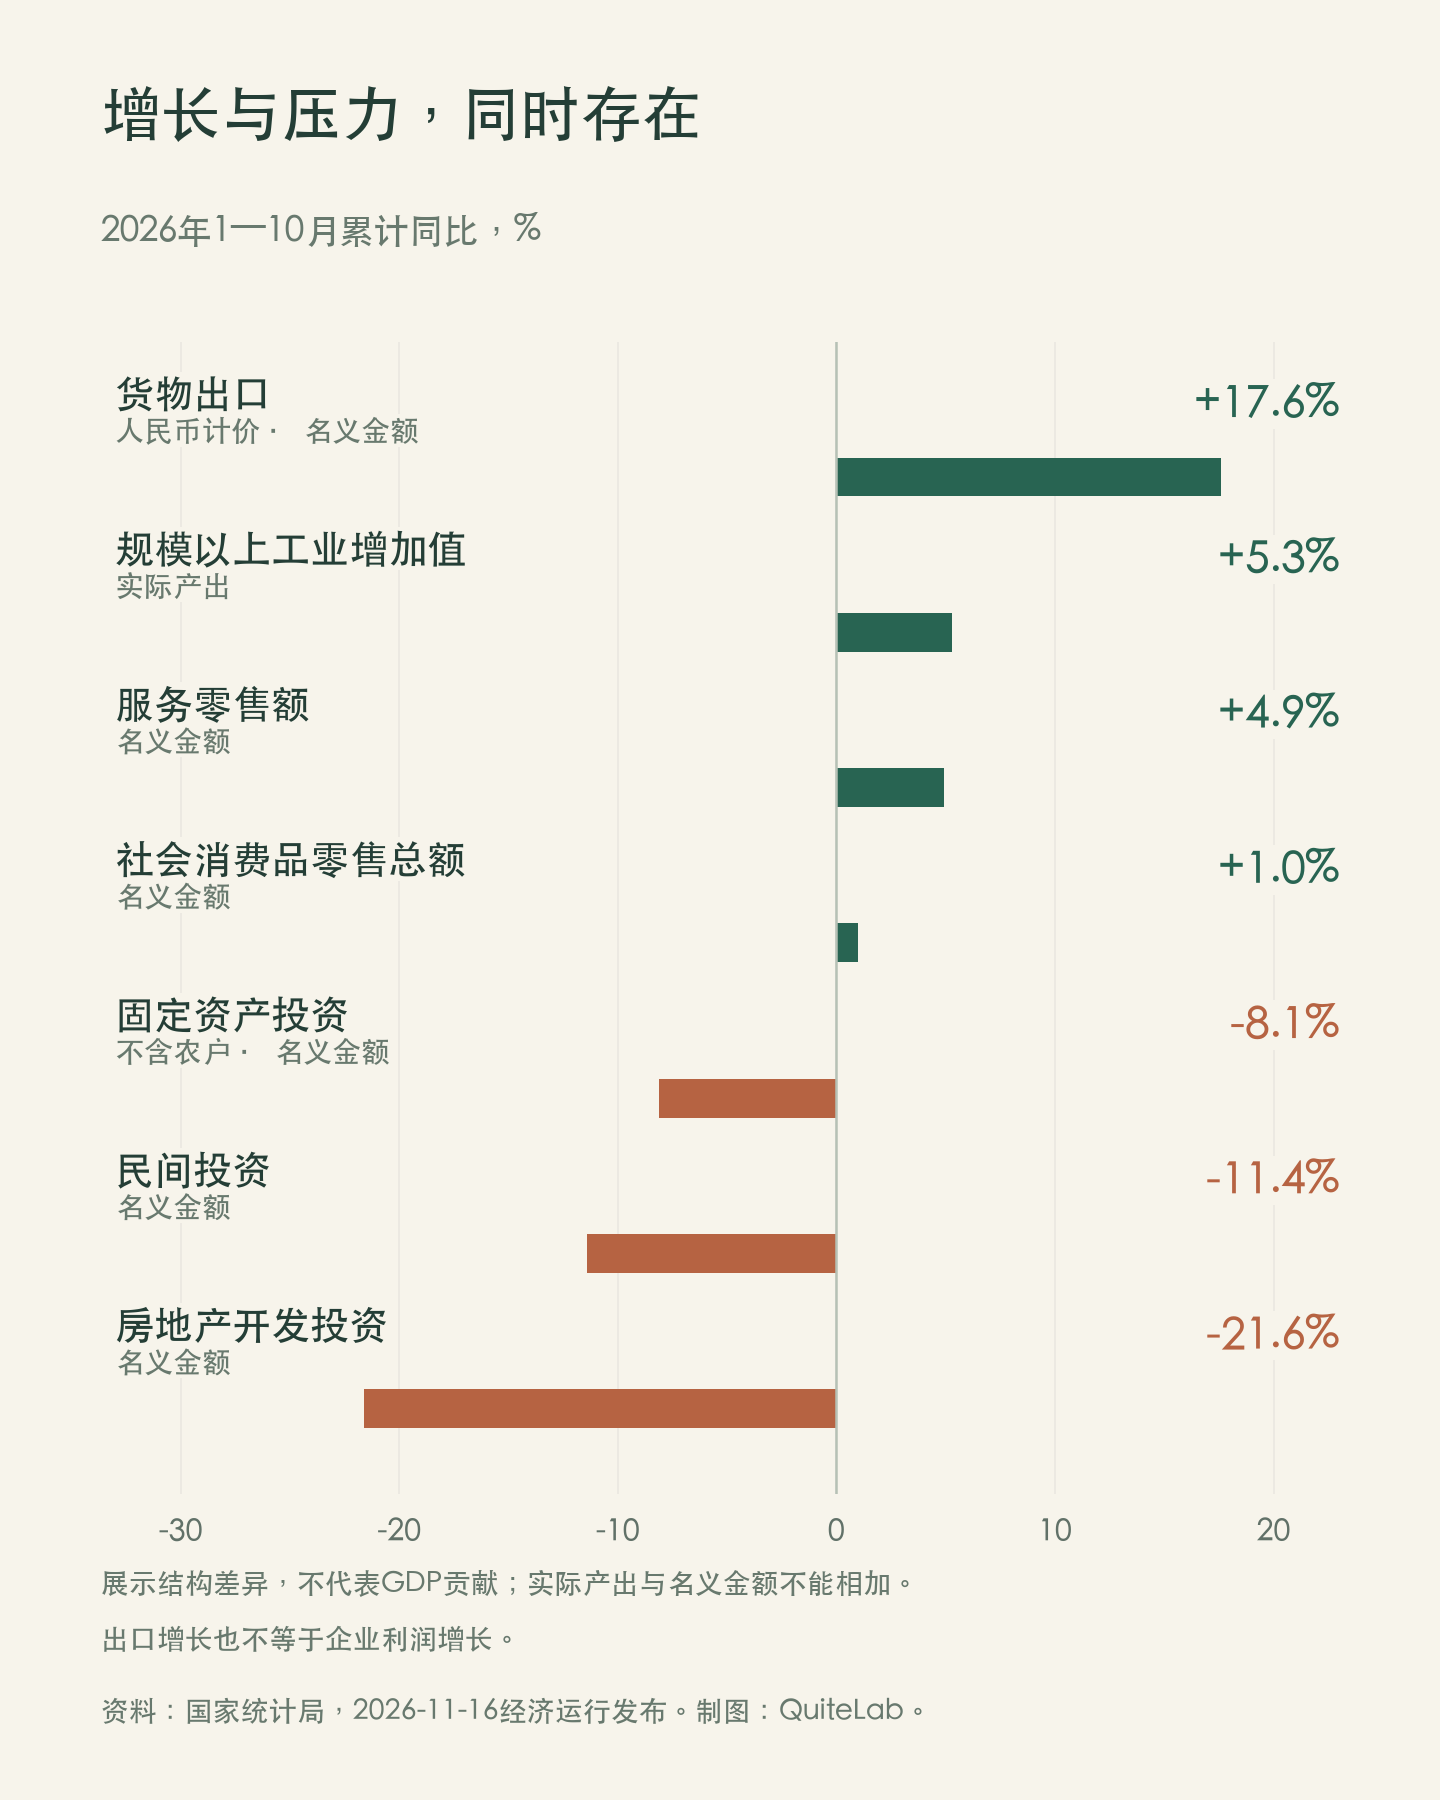
1—10月,生产和出口较强,商品消费、投资与房地产承压。服务零售增速高于商品端,说明消费内部也有差异。社会消费品零售总额主要反映商品和餐饮,并不包含全部服务消费;不能把它增长1.0%写成“居民全部消费只增长1.0%”。[2]
投资压力也不只来自房地产:扣除房地产开发的民间投资仍下降7.8%。与此同时,高技术制造业增加值实际增长14.6%,部分领域继续扩张。机会需要落到具体岗位和客户需求上,例如现有行业中的设备维护、供应链或客户服务。一个行业增长较快,并不能证明进入其中的每个人都能获利。[2]
需求偏弱,也可能遇上成本上涨
10月CPI同比上涨0.7%,扣除食品和能源的核心CPI上涨0.8%;工业出厂价格PPI上涨5.7%,工业购进价格上涨7.9%。居民端价格温和,工业端价格涨幅较大。统计局解读显示,能源相关行业是当月PPI环比上行的主要推力,不能沿用“所有价格都在跌”的判断。[3][4]
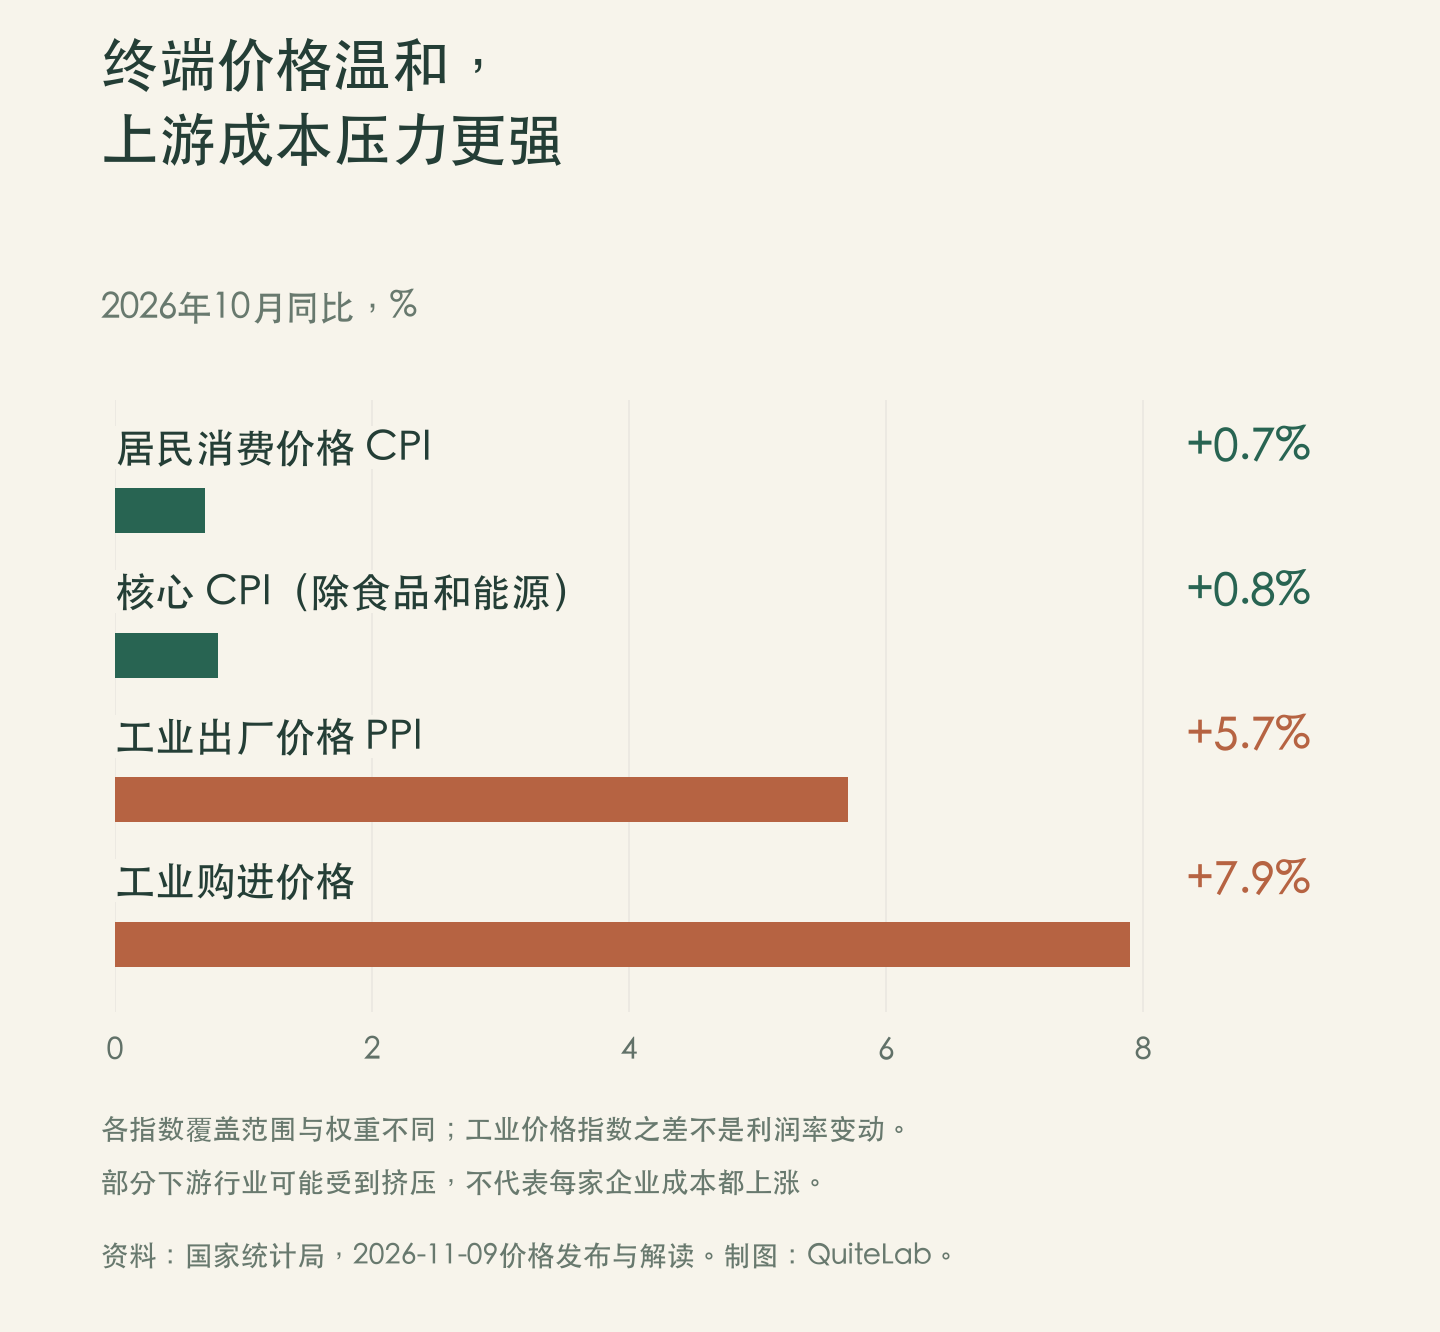
对部分下游企业,采购成本上升而售价难涨,利润就可能受到挤压。这是需要检查的经营机制,不代表所有企业利润都下降。具体企业还要看订单、工资、库存、汇率和费用。对家庭,个人感受也取决于自己的消费结构,不能只用全国CPI代替日常账本。
为什么增长没有均匀地落到每个人身上
房地产调整会影响家庭的财富感受和大额支出选择;企业看到订单不确定,也可能推迟投资和招聘。与此同时,新产业增加的岗位,未必与减少的岗位位于同一城市、要求同一种技能。行业转移、再培训和家庭责任,都会影响个人能否抓住新的机会。这些是传导机制的解释,并非对各因素影响比例的估算。
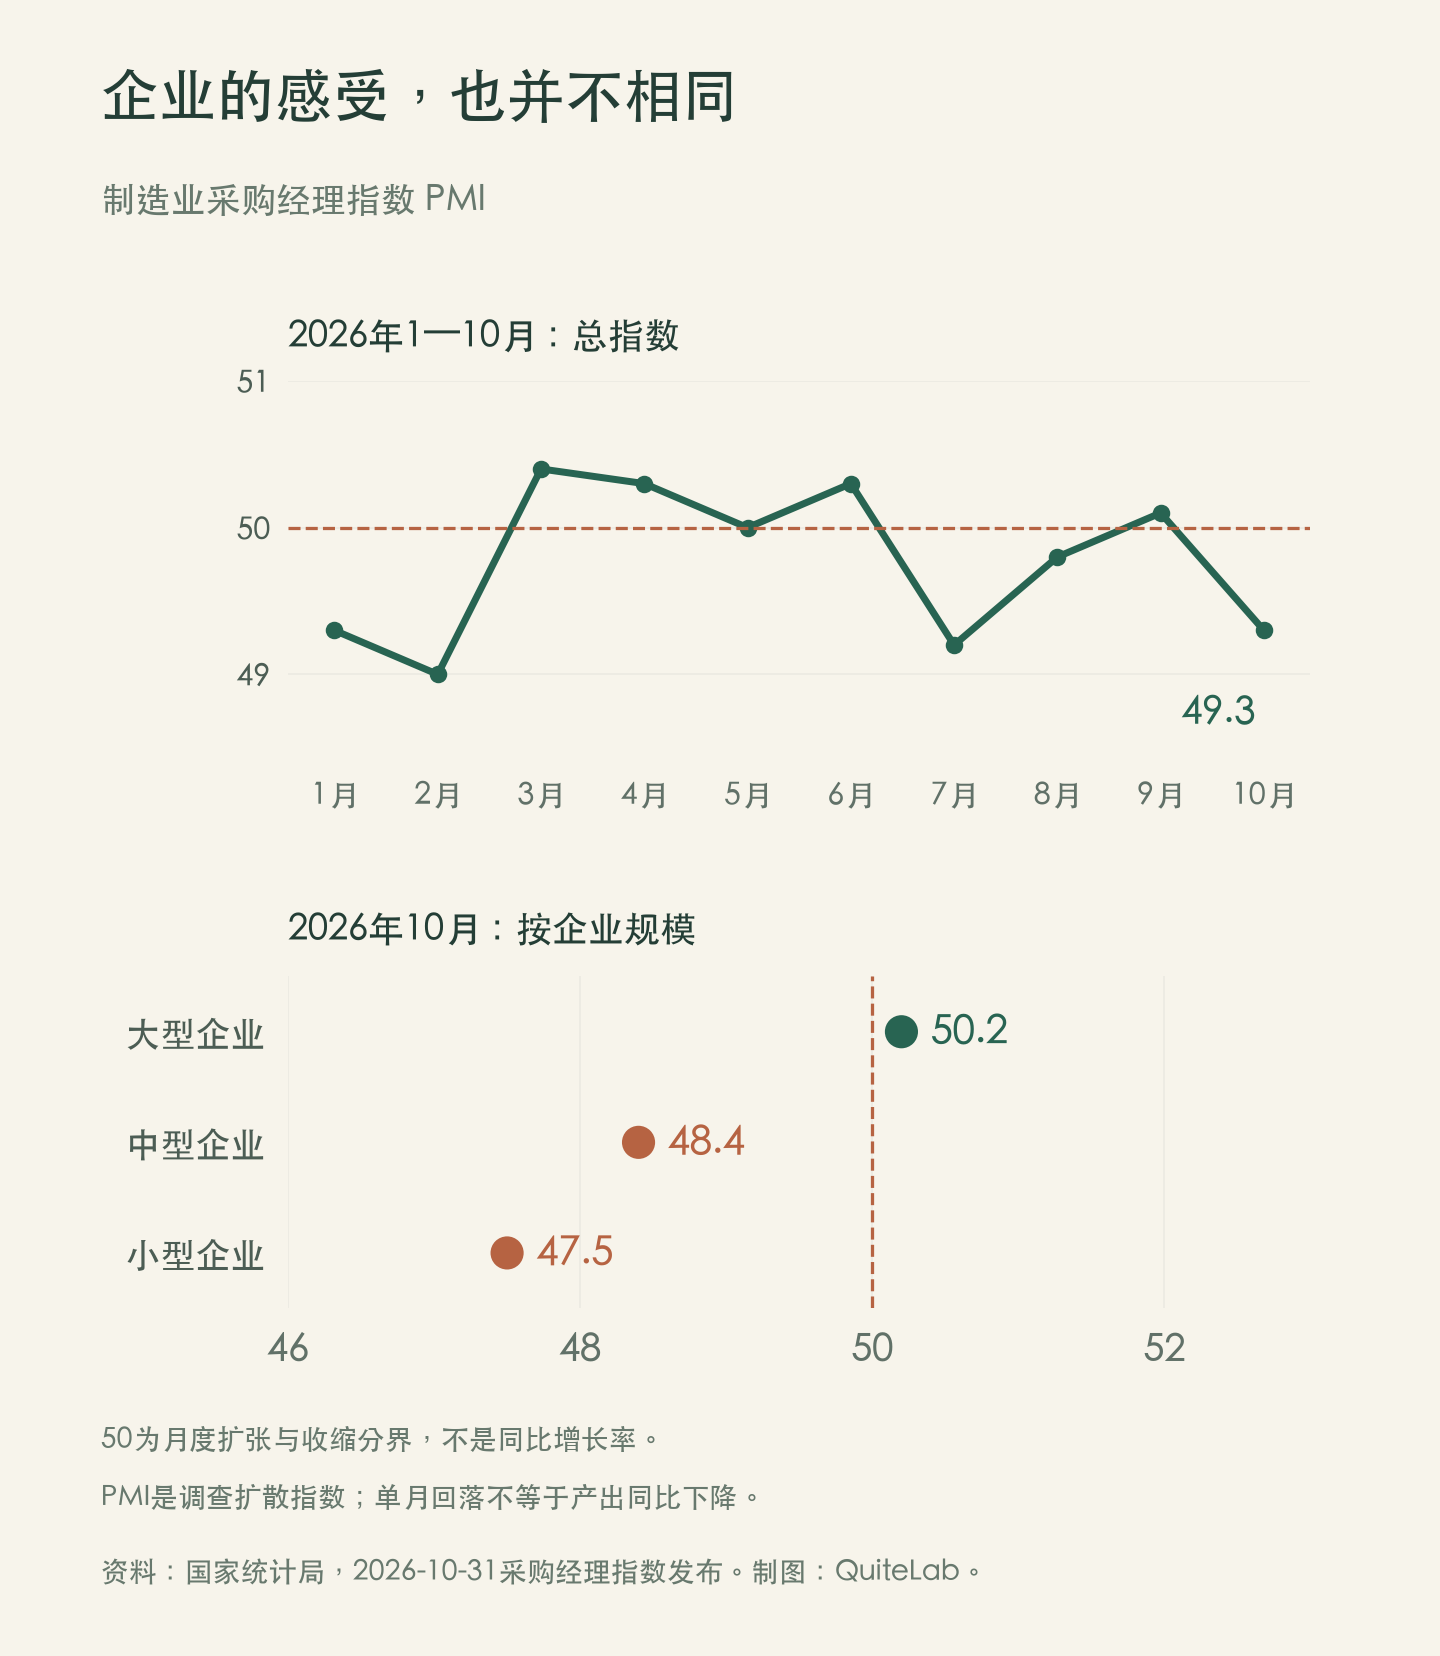
前三季度,全国居民人均可支配收入实际增长4.4%,人均消费支出实际增长2.7%;收入中位数为28388元,名义增长4.6%。平均数、中位数和个人工资是不同概念,人均收入还包含家庭中的非就业成员。它们能提供背景,却不能替某个家庭证明生活已经改善或恶化。[6]
因此,身边的经历值得听,也需要说明范围。一个商圈的冷清、一家公司的裁员或一个出口企业的忙碌,都能提出有价值的问题;要判断全国趋势,还需与更广的数据交叉核对。讨论时讲清楚行业、时间和变化,比急着给整个经济下一个结论更有帮助。
国际机构怎么看,预测又能告诉我们多少
| 机构与版本 | 2026年预测 | 2027年预测 |
|---|---|---|
| IMF,2026年10月亚太展望 | 4.5% | 4.0% |
| OECD,2026年9月中期展望 | 4.5% | 4.2% |
| 亚洲开发银行,2026年9月展望 | 4.6% | 4.5% |
这些基准预测都指向继续增长,但机构关注的约束不同:IMF强调净出口支撑与内需压力,OECD关注能源价格和投资环境。预测的模型、日期和假设不同,而且都早于今天公布的10月经济数据。宏观预测不能直接换算成个人收入、房价或投资回报。[7][8][9]
个人可以为几种情况同时准备:收入和需求改善时,分阶段增加经过验证的投入;经济继续增长但自身行业改善有限时,控制固定支出、积累可迁移能力;需求再弱或成本再升时,优先减少现金缺口。这里没有给情景分配概率,也不预言何时见底,而是让不同结果出现时都有可执行的安排。
先算清楚,自己的现金能撑多久
个人可以先做一张表:最近几个月实际到账收入、必要生活支出、到期还本付息,以及未来一年确定的大额开支。可用应急资金,只计能够及时支取、波动很小且未被其他用途占用的钱;信用额度、未到账奖金和待售房产都不等于现金。
零收入支撑月数=可用应急资金÷每月必要支出(含到期还本付息)。“六个月”或“十二个月”只是测试参数。单收入、赡养负担较重、按项目结算或重新就业周期长的人,需要结合自己的情况增加缓冲;已经存在生活缺口的人,应先处理收入和基本保障。
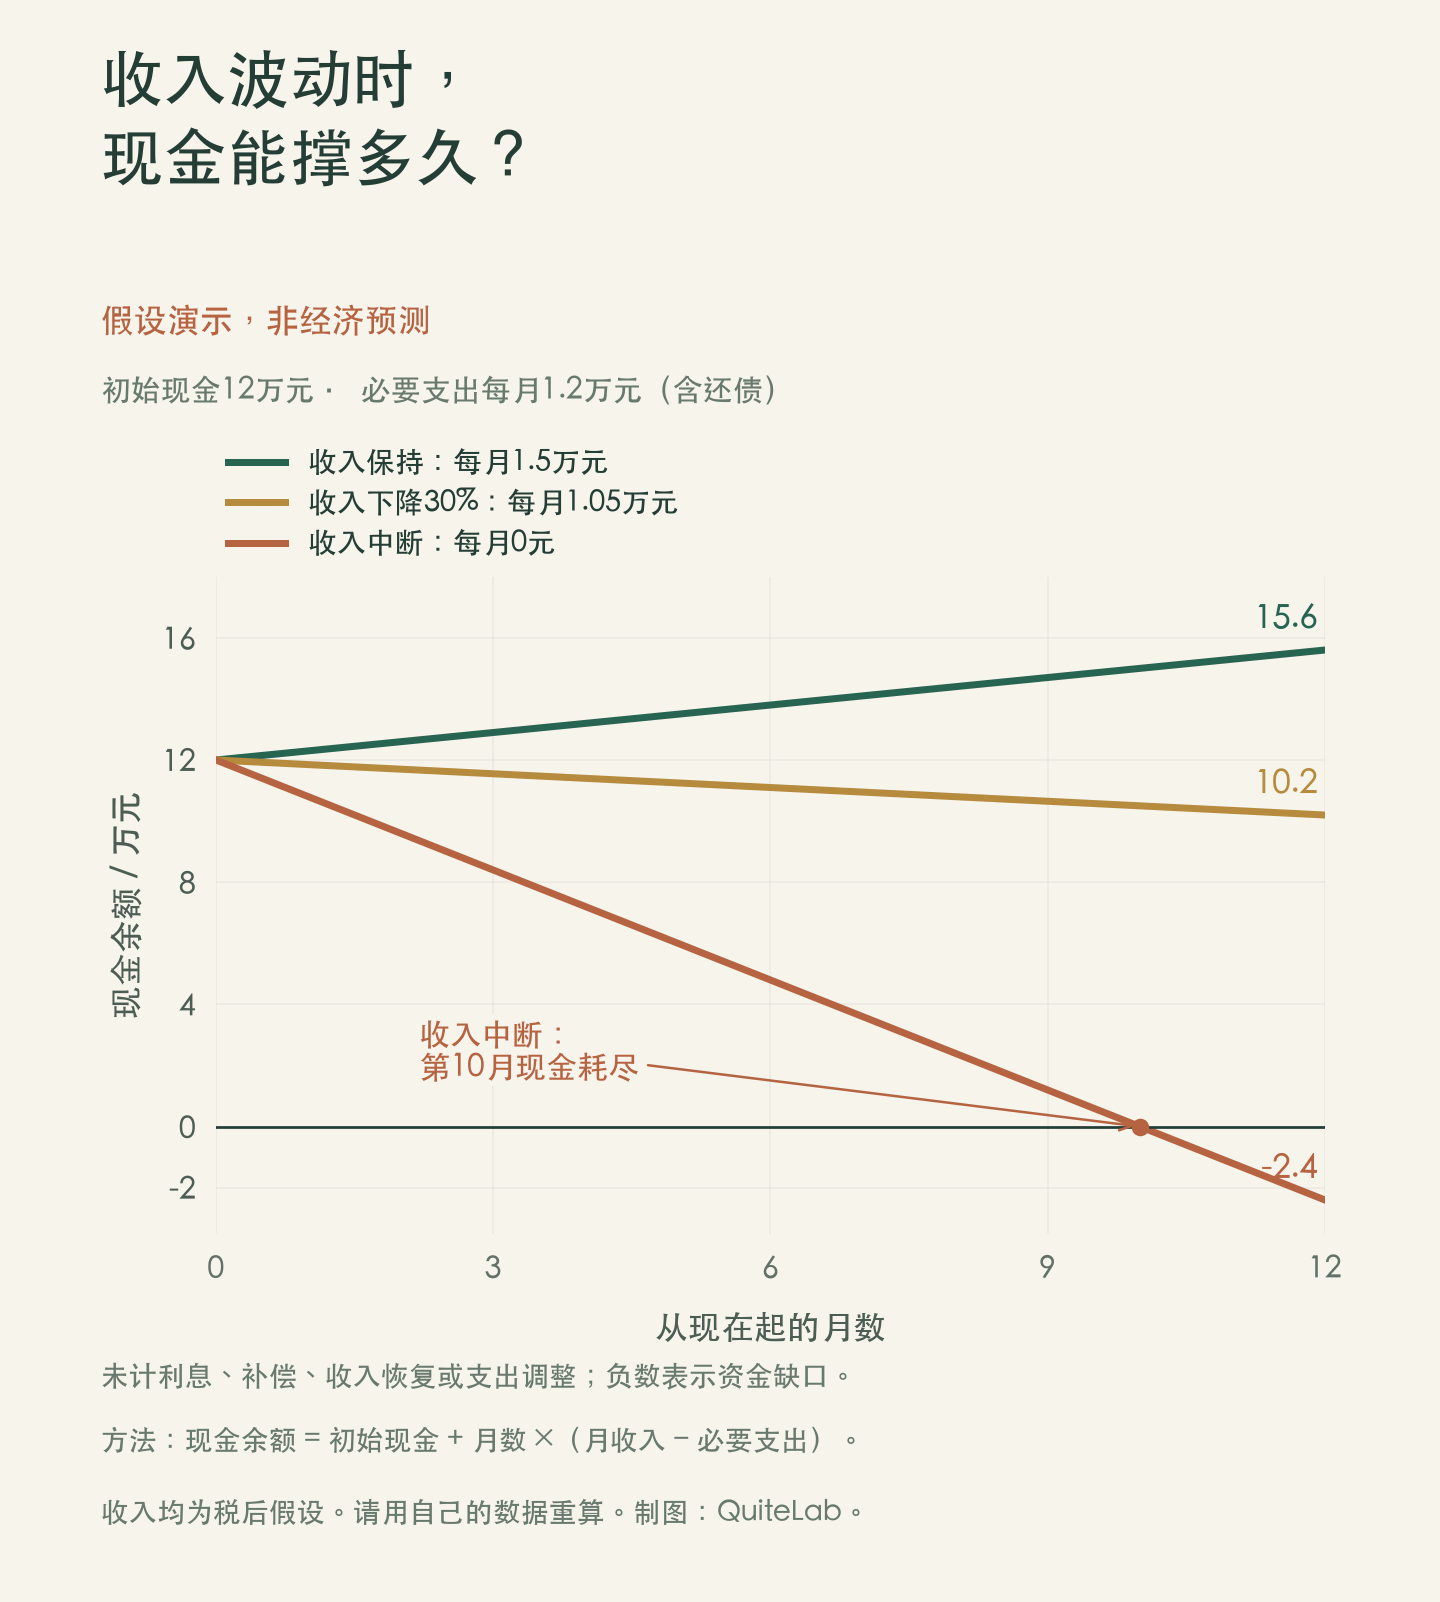
再加一组组合测试:收入减少20%,必要生活支出增加5%,债务仍按合同支付。重要的是看现金缺口能持续多久,以及自己需要多少时间调整工作或生意。这些比例是自设情景,不代表未来一定发生。
房子、工作和生意,分别算账
- 债务与住房:整理每笔债务的综合成本、到期日、担保和提前偿还条件。提前还贷要看还款后还剩多少流动资金,以及更需要降低月供还是减少利息。买房同时计算居住成本与实际月供,并测试收入下降、持有期延长和短期卖不出的情况。
- 工作与技能:从已有经验出发,查看一批真实岗位或潜在客户的需求,找出反复出现的要求,再做一个可以展示和验收的成果。AI、外语、销售和数据工具是否值得学,要看能否改善实际交付;课程或证书本身不保证收入。
- 小生意:做未来13周的现金收支表,把回款、采购、工资、租金、税费和借款到期排到每周。每单实收净额减去商品、平台、支付、履约和获客等随单成本,得到的贡献还要覆盖固定费用。退款已从实收中扣除的,不重复扣。
- 资产安排:随时要用的钱,先看支取便利与本金波动;有确定用途的钱,匹配支付日期;能长期不用的钱,再按风险承受能力讨论投资。也检查工资、房产、投资和主要客户是否都依赖同一个城市或行业。
用一个经营假设说明:销售额100、变动成本75,扣固定费用前贡献为25。如果单位成本涨8%、售价不变,贡献降至19,减少24%;再叠加销量下降10%,总贡献为17.1,比原来少31.6%。这里的8%只是测试参数,不能拿全国PPI直接替代某家店的采购成本。它提醒经营者,营收变化不大,利润和现金仍可能明显变差。
电商和外贸还应把汇率、运费、平台费用、退款和库存账龄放进同一本账。提前测试最大客户晚付60天、主要渠道中断或库存需要折价出售的情况,检查工资和到期账款能否支付。新业务先规定试验的金额和时间上限,再用实际回款决定下一步,家庭基本生活资金也要安排清楚。
未来三个月,可以先做什么
| 时间 | 可以完成的事 |
|---|---|
| 第1—7天 | 列收入、必要支出和债务,完成一次现金压力测试。 |
| 第8—30天 | 调整可撤销支出,核对已有保障和高成本债务;经营者追踪逾期回款。 |
| 第31—60天 | 用真实岗位或客户需求,验证一个技能成果或小规模经营试验。 |
| 第61—90天 | 根据实际收入、贡献和回款,重新决定下一季度投入。 |
宏观数据帮助理解背景,个人账本决定行动。家庭现金流持续为负,就尽早调整支出与付款安排;订单贡献下降、回款变慢,就重新核算库存和赊销;收入与贡献持续改善,再分阶段增加经过验证的投入。个人不必先猜中经济拐点,才开始做这些事。
安排生活也不只有省钱。把重复、低效或超出承受能力的支出减下来,同时在预算内照顾健康、家庭关系和长期能力。收入稳定的人与已经出现缺口的人,行动顺序会不同;照顾孩子、老人和自己的时间,同样是做决定时需要计算的成本。
你身边的变化,是什么样的
同一组经济数据,落到不同年龄、职业和家庭里,会有不同感受。欢迎带着具体经历来聊,也给不同意见留些空间。可以从下面三个问题中选一个,不必公开资产金额、单位、住址或联系方式。
- 过去一年,你感受最明显的变化是在工作收入、生意利润,还是家庭开支?
- 面对不确定,你做过哪项调整,后来证明有用?
- 如果接下来三个月只先做一件事,你会选择什么?
资料说明:统计数据可能修订,本文注明的预测属于各机构发布时的判断。图1—3根据已公布数据重绘,图4及经营例子是假设演示。个人行动部分是分析框架,需要结合自己的账本、合同和当地情况使用。
资料来源与阅读说明
文中区分已公布统计、机构预测与分析建议。统计数据可能修订;情景示例用于说明计算方法,不是预测或统一适用的理财标准。
- 国家统计局:2026年前三季度国民经济运行 ↗2026-10-19
- 国家统计局:2026年10月份国民经济运行 ↗2026-11-16
- 国家统计局:2026年10月份CPI与PPI解读 ↗2026-11-09
- 国家统计局:2026年10月份工业生产者价格 ↗2026-11-09
- 国家统计局:2026年10月采购经理指数 ↗2026-10-31
- 国家统计局:2026年前三季度居民收入和消费支出 ↗2026-10-19
- IMF:2026年10月亚太区域经济展望,第1章 ↗2026-10-15
- OECD:2026年9月中期经济展望 ↗2026-09-23
- 亚洲开发银行:中国经济预测,2026年9月版 ↗2026-09-23
把话题留给大家
过去一年,你最明显感受到的变化是什么?有哪些调整对你有用?欢迎分享具体经历,不必公开个人财务或联系方式。
PERSONAL NOTES · ECONOMY & EVERYDAY LIFE
Where Does China’s Economy Stand, and How Should We Plan Our Lives?
The economy is still growing, yet earning a living can feel harder. A look at the latest data, household income, mortgages, cash flow and small businesses, with room for different experiences.
Join the conversationGrowth continues, but experiences differ
Discussions of China’s economy often bring together two experiences: expanding production, exports and new industries, alongside pressure on job seekers, businesses and household budgets. Both can exist at once. A household’s experience depends on where its income comes from, its debt commitments and whether its assets can be turned into usable cash. This article brings together data verified as of 16 November 2026, then considers the choices people face in everyday life.
Real GDP grew 4.6% year on year in the first three quarters. Growth in the first, second and third quarters was 5.0%, 4.3% and 4.5%, respectively. The economy continued to expand, but GDP measures value added across the economy. It does not mean that wages in a particular industry, a shop’s profit or a household’s income rose at the same rate.[1]
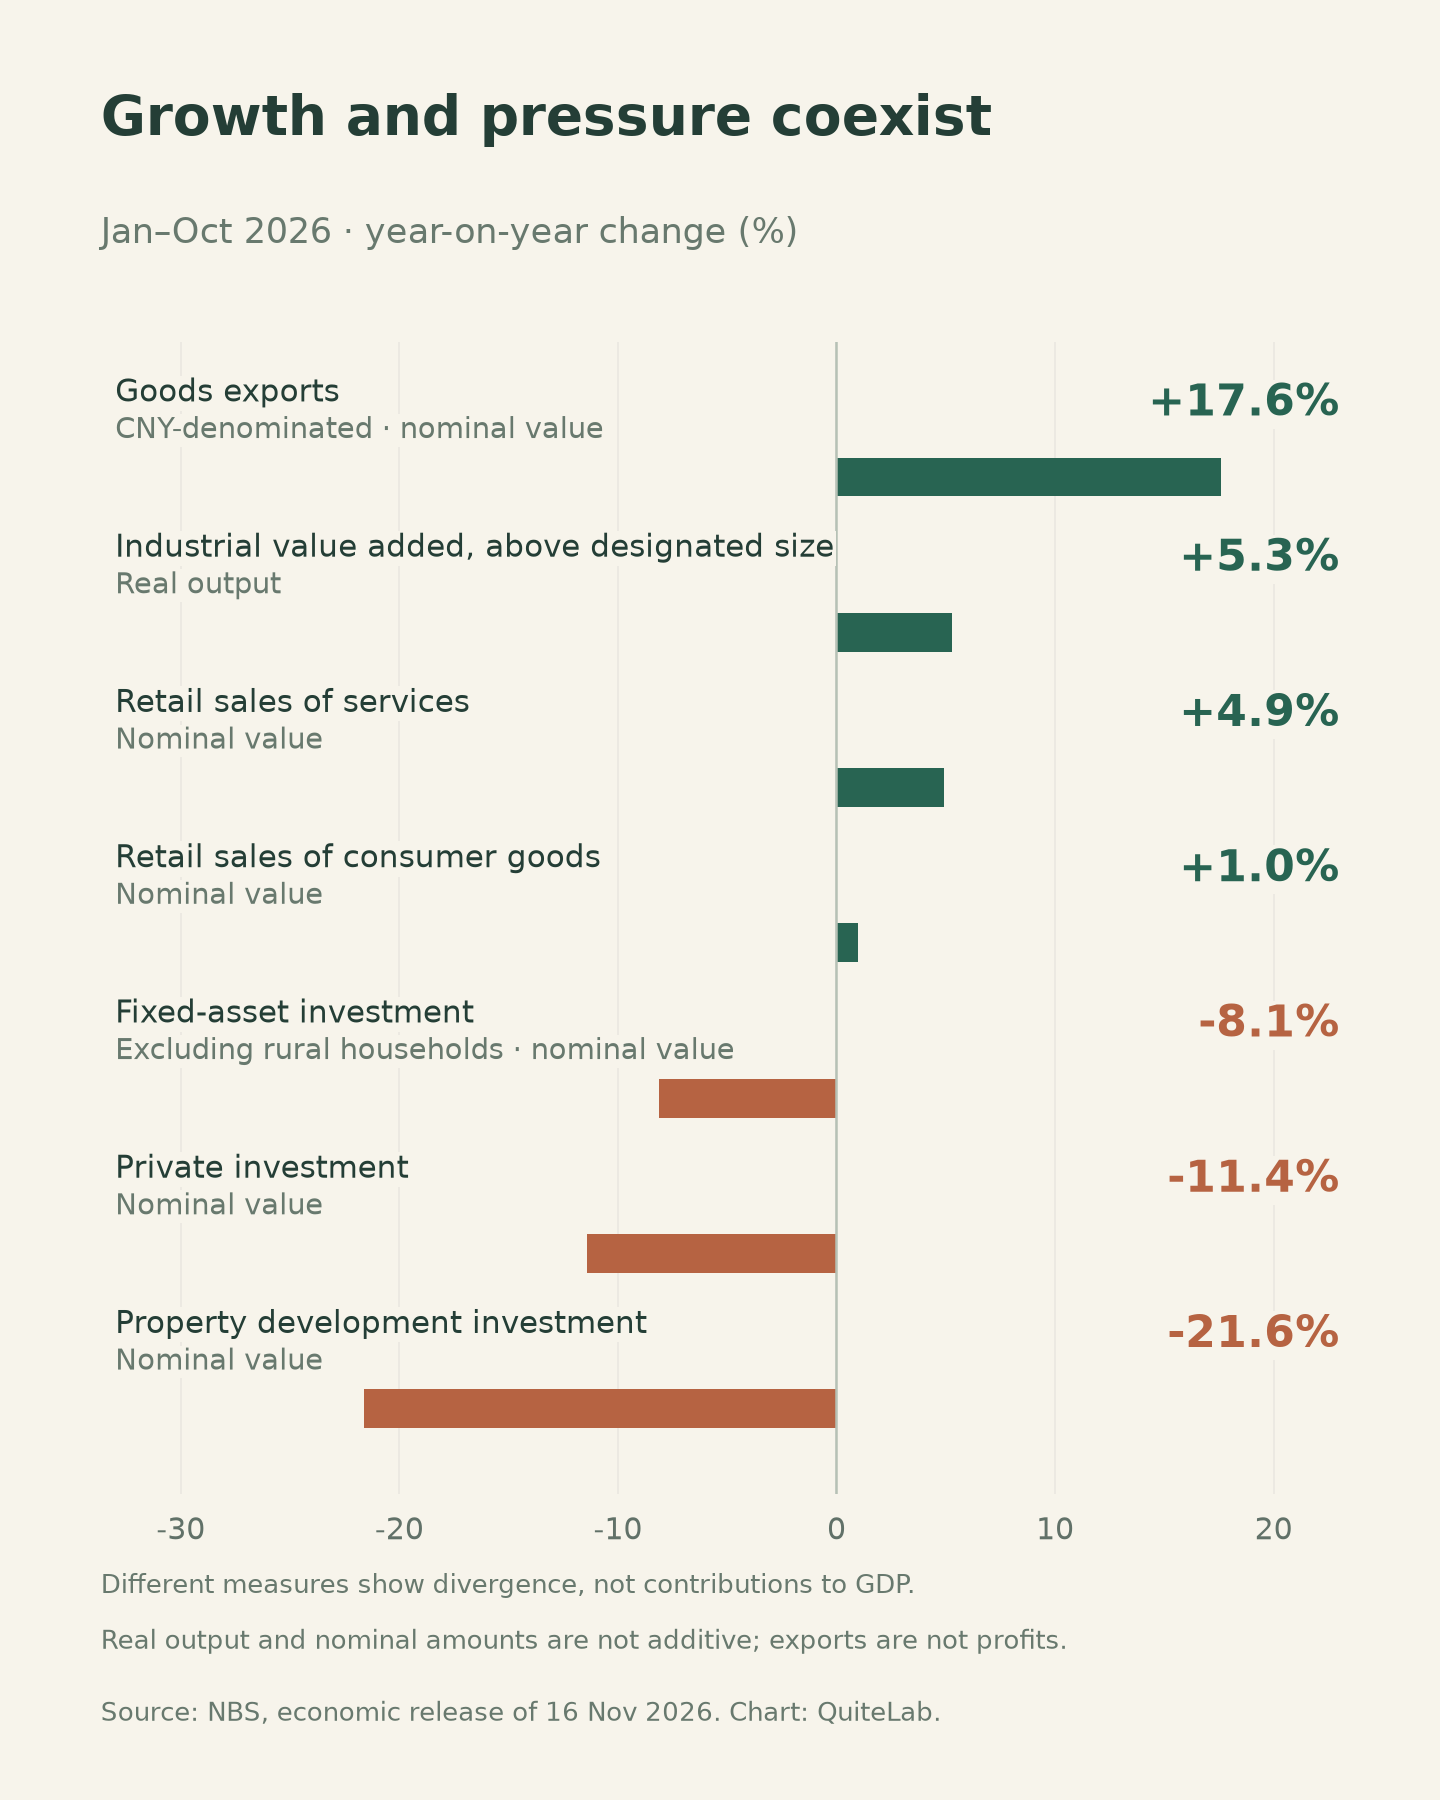
From January to October, production and exports were stronger, while goods consumption, investment and property remained under pressure. Services retail sales grew faster than goods sales, showing differences within consumption too. The standard retail sales measure mainly covers goods and catering, rather than all services. Its 1.0% growth should not be described as growth in all household consumption.[2]
Investment weakness extends beyond property: private investment excluding property development still fell 7.8%. At the same time, real value added in high-tech manufacturing grew 14.6%, showing continued expansion in some areas. Opportunities need to be identified through specific jobs and customer needs, such as equipment maintenance, supply chains or customer service in an industry you already know. Fast growth in a sector does not establish that everyone entering it will profit.[2]
Soft demand can coincide with rising costs
In October, consumer prices rose 0.7% year on year, while core CPI, excluding food and energy, rose 0.8%. Industrial producer prices increased 5.7%, and industrial purchasing prices rose 7.9%. Consumer inflation remained modest, while industrial price increases were larger. The National Bureau of Statistics identified energy-related industries as the main drivers of the monthly PPI increase. A claim that all prices are falling no longer fits these figures.[3][4]
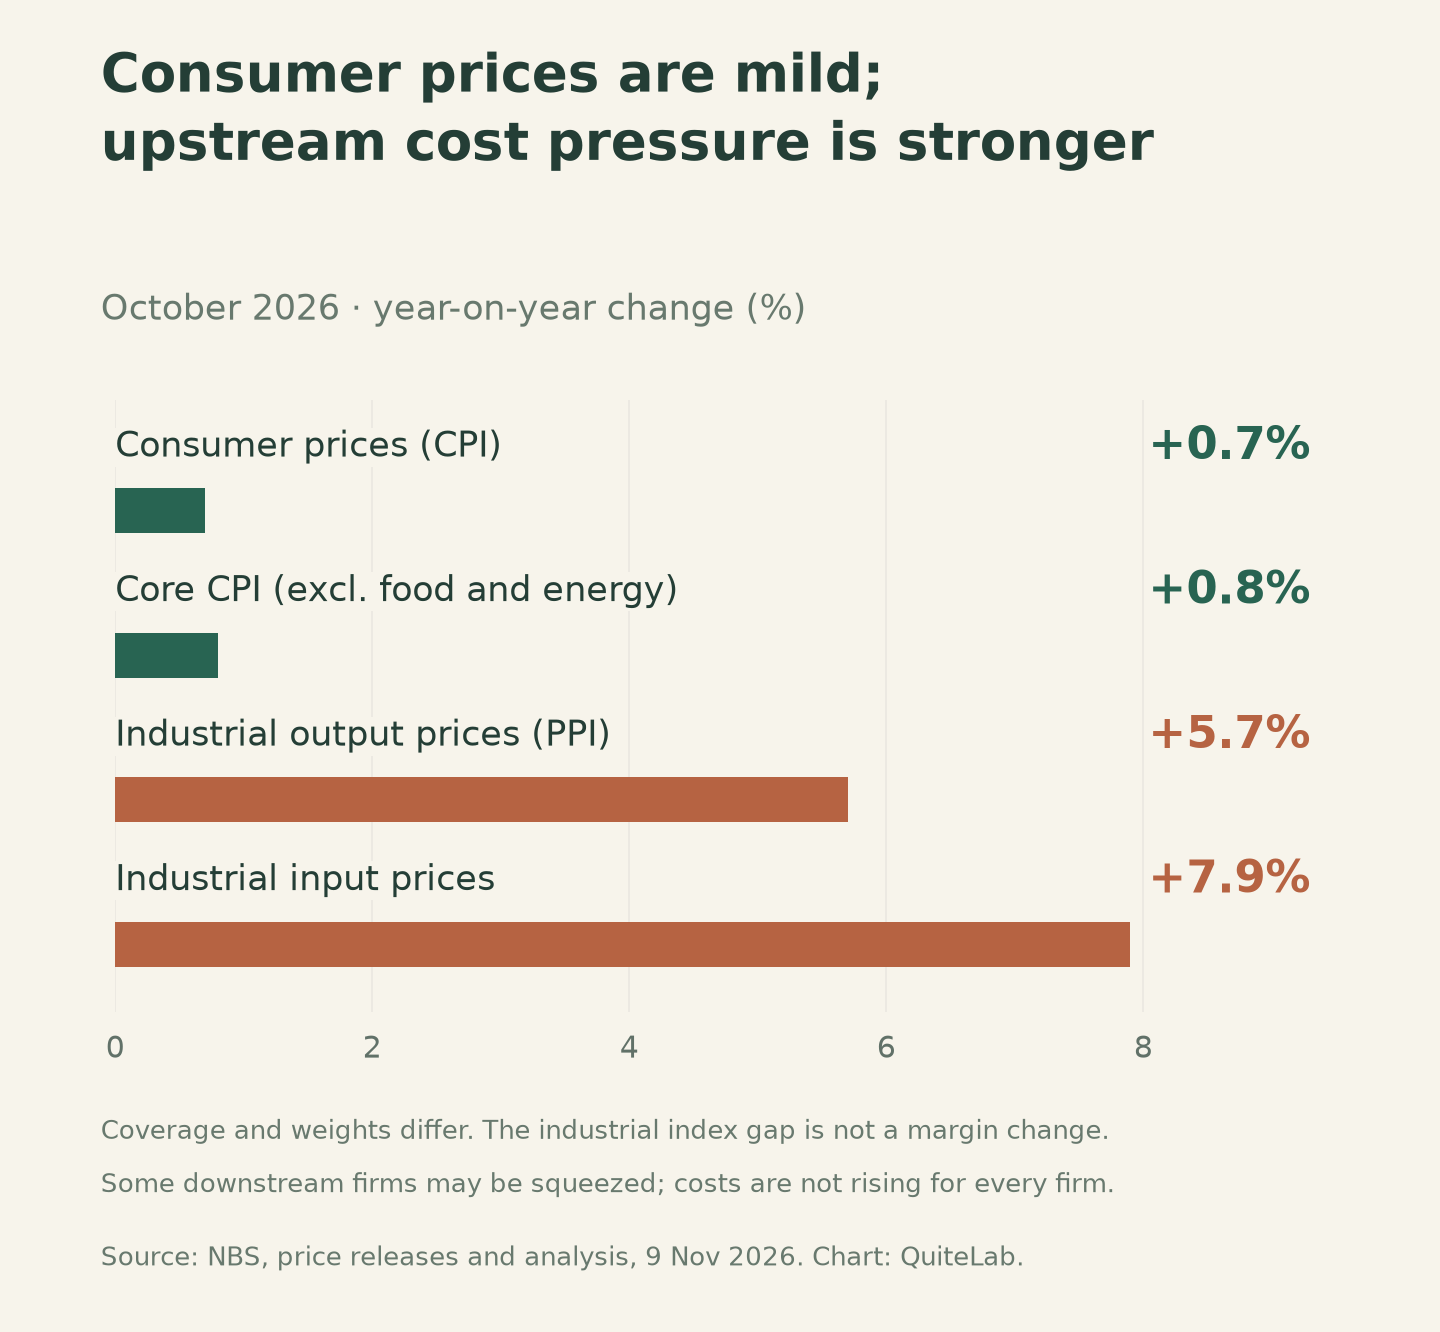
For some downstream businesses, higher purchasing costs combined with limited pricing power may squeeze profits. This is a mechanism worth checking, not evidence that every company’s profit is falling. Orders, wages, inventories, exchange rates and expenses also matter. Households experience inflation differently according to what they buy, so the national CPI cannot replace a personal spending record.
Why growth does not reach everyone equally
A property adjustment can affect how wealthy households feel and their willingness to make major purchases. Businesses facing uncertain orders may postpone investment and hiring. At the same time, jobs created by new industries may require different skills or be located in different cities from those being lost. Moving, retraining and family responsibilities affect access to new opportunities. These are explanations of possible transmission channels, not estimates of their individual contributions.
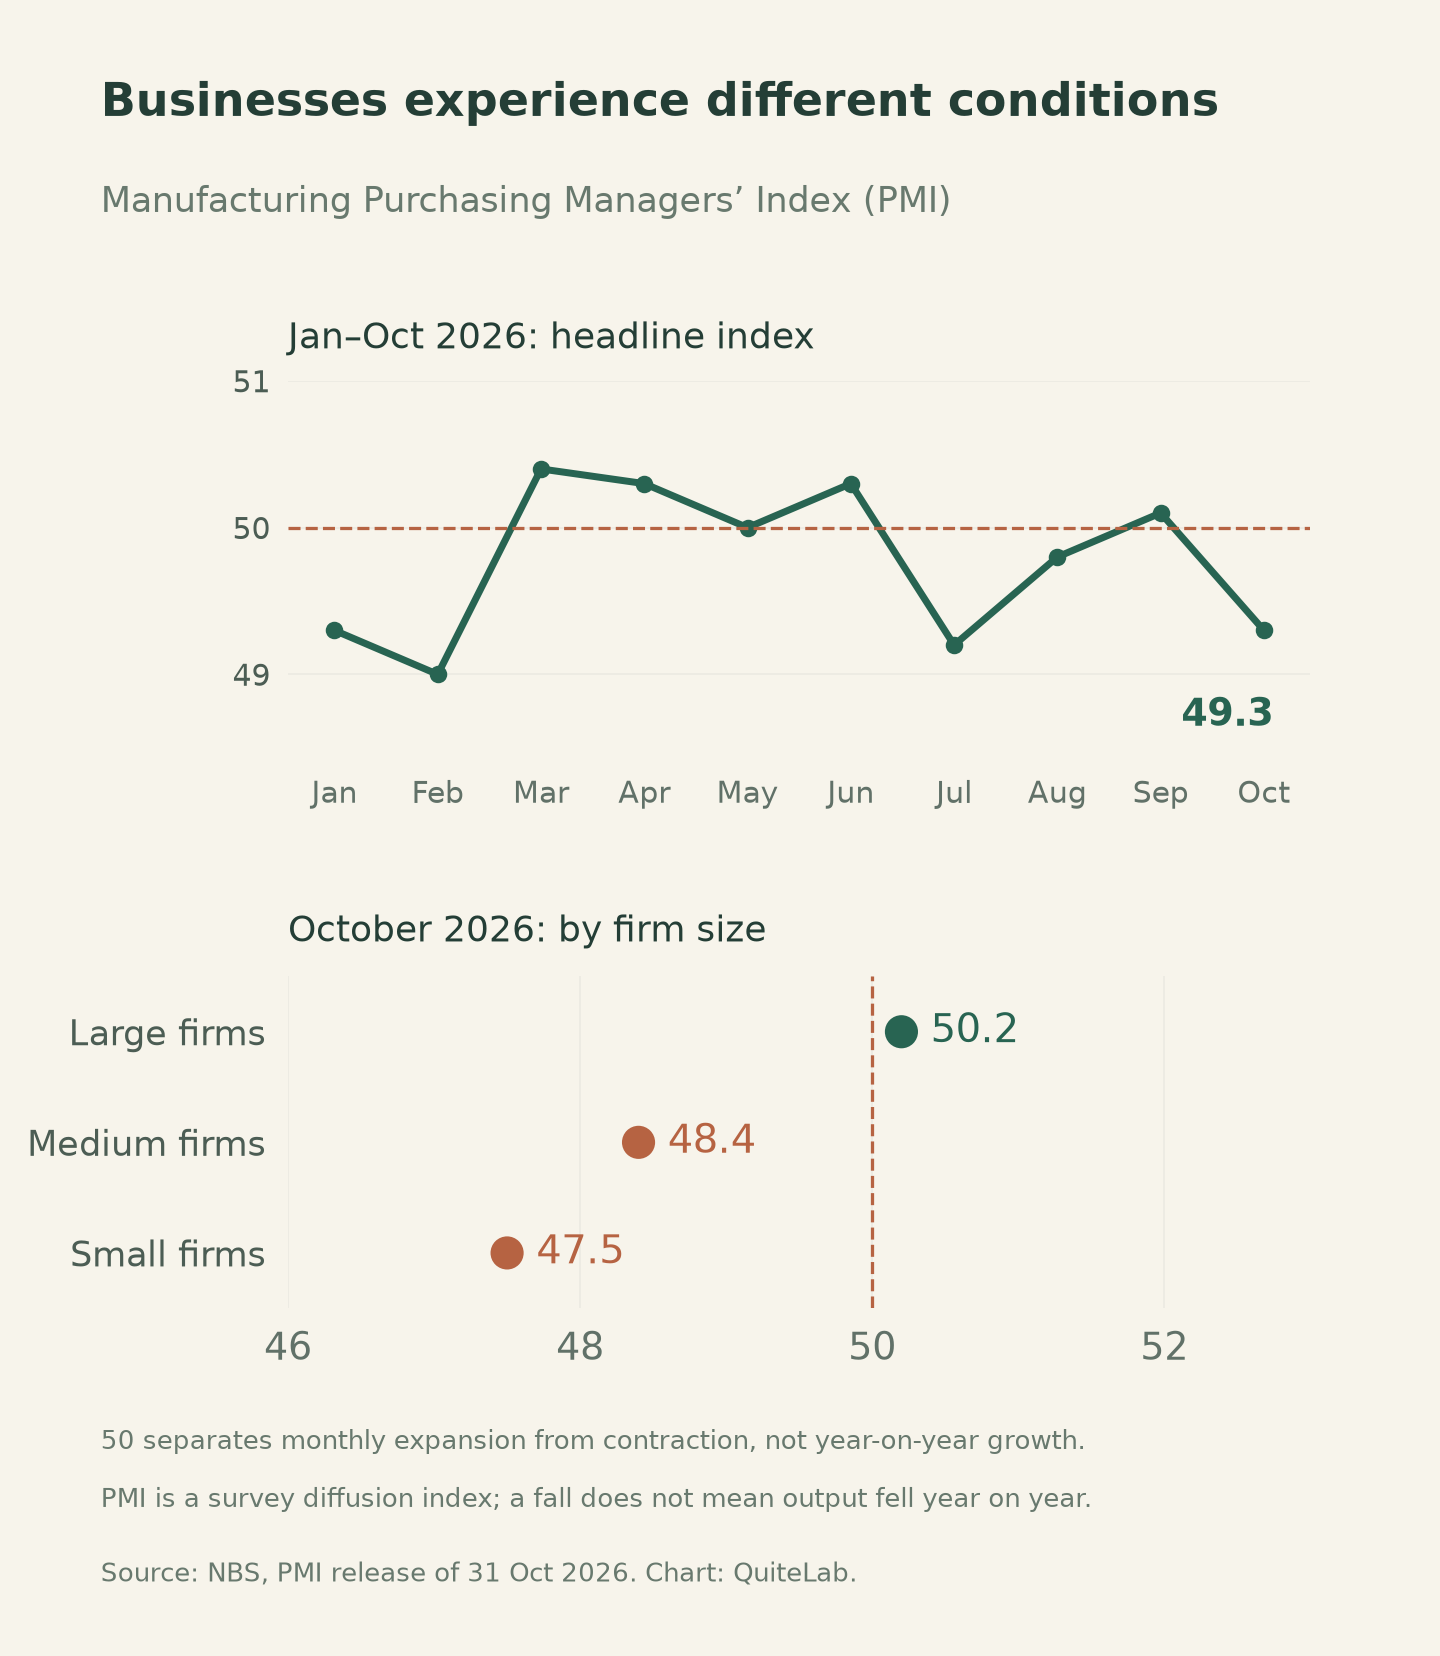
In the first three quarters, real per capita disposable income rose 4.4%, while real per capita consumption expenditure rose 2.7%. Median disposable income was RMB28,388, up 4.6% in nominal terms. Averages, medians and an individual worker’s wage are different measures. Per capita household figures also include people who are not employed. They provide context, but do not establish whether a particular family is better or worse off.[6]
Personal experiences deserve attention, with their scope made clear. A quiet shopping district, redundancies at one company or a busy exporter can all raise worthwhile questions. Assessing a national trend requires checking broader evidence as well. Identifying the industry, period and change involved makes a discussion more useful than rushing to a verdict on the whole economy.
What international forecasts can tell us
| Institution and edition | 2026 forecast | 2027 forecast |
|---|---|---|
| IMF, October 2026 Asia-Pacific outlook | 4.5% | 4.0% |
| OECD, September 2026 interim outlook | 4.5% | 4.2% |
| ADB, September 2026 outlook | 4.6% | 4.5% |
All of these baseline forecasts point to continued growth, although institutions emphasise different constraints. The IMF highlights support from net exports alongside weak domestic demand, while the OECD considers energy prices and investment conditions. Models, publication dates and assumptions differ, and all three editions predate the October economic data released today. A macroeconomic forecast cannot be translated directly into personal income, house prices or investment returns.[7][8][9]
People can prepare for several outcomes at once. If income and demand improve, increase tested commitments gradually. If the economy grows but your industry sees little improvement, manage fixed costs and develop transferable capabilities. If demand weakens further or costs rise again, prioritise reducing cash shortfalls. These scenarios carry no assigned probabilities or prediction of a bottom; they provide practical responses to different possible outcomes.
Start with your own cash runway
Start with a simple record of income actually received over recent months, essential living costs, debt payments due and known major expenses over the next year. Available emergency funds should be accessible, relatively stable in value and free of other commitments. Credit limits, unpaid bonuses and property waiting to be sold are not the same as cash.
Months of cover with no income = available emergency funds ÷ monthly essential outgoings, including debt payments due. Six or twelve months are only planning parameters. Households with one income, substantial caring responsibilities, project-based earnings or a lengthy search for a new job may need a larger buffer. Anyone already struggling to cover basic living costs should first address that shortfall and the support available to them.
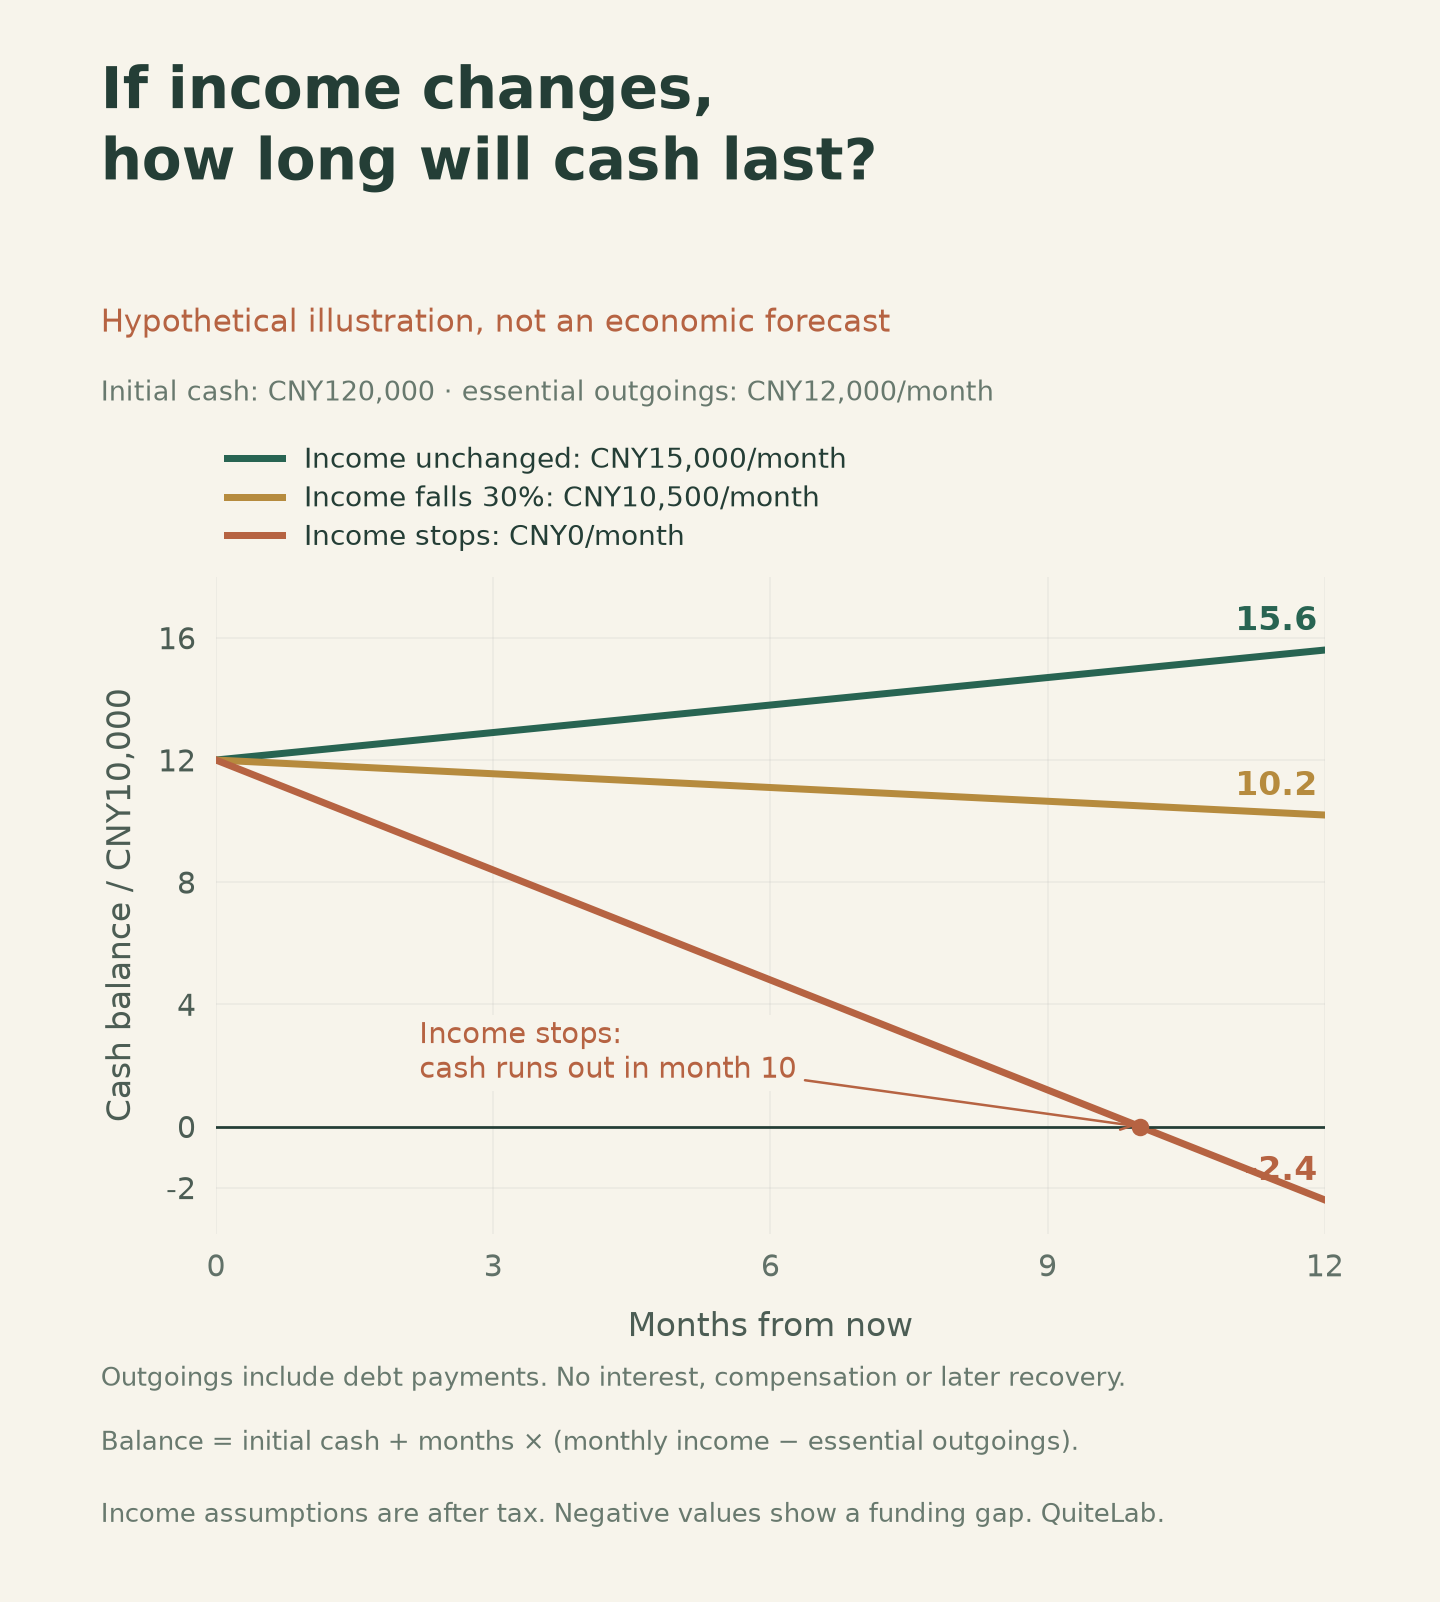
Add a combined stress test: income falls 20%, essential living costs rise 5% and contractual debt payments continue. Check how long a shortfall could be funded and how much time you would need to change your work or business. These percentages are chosen scenarios, not predictions.
Separate the decisions about housing, work and business
- Debt and housing: record each debt’s total cost, due dates, guarantees and early repayment terms. Before repaying a mortgage early, consider the cash left afterwards and whether reducing monthly payments or total interest matters more. A home purchase needs both a housing-cost calculation and a monthly cash-flow budget, tested against lower income, a longer holding period and difficulty selling quickly.
- Work and skills: build on existing experience. Review real vacancies or prospective customers’ needs, identify recurring requirements and produce something that can be demonstrated and assessed. The value of learning AI tools, languages, sales or data skills depends on whether they improve real work. A course or certificate alone does not guarantee income.
- Small businesses: prepare a cash-flow schedule for the next thirteen weeks, showing receipts, purchasing, payroll, rent, taxes and debt due each week. Net receipts per order minus variable costs such as goods, platform fees, payments, fulfilment and customer acquisition leave a contribution that must still cover fixed costs. Do not deduct refunds twice if they are already excluded from net receipts.
- Assets: money that may be needed at short notice calls for access and stability; money committed to a known expense needs to match its payment date. Investing longer-term funds requires an assessment of risk capacity. Also check whether your salary, property, investments and main customers all depend on the same city or industry.
Consider a hypothetical business with sales of 100 and variable costs of 75, leaving a contribution of 25 before fixed costs. If unit costs rise 8% with no price increase, contribution falls to 19, a 24% reduction. If volume then falls 10%, total contribution is 17.1, down 31.6% from the original level. The 8% is only a test parameter; national PPI cannot stand in for a particular shop’s purchasing costs. The example shows how modest revenue changes can coincide with a much larger deterioration in profit and cash flow.
E-commerce and export businesses should include exchange rates, freight, platform fees, refunds and inventory age in the same assessment. Test what happens if the largest customer pays sixty days late, a major channel is interrupted or inventory must be discounted, and whether payroll and bills can still be paid. Set spending and time limits for a new business experiment, then use cash actually received to decide the next step, with household essentials clearly provided for.
What to do over the next three months
| Timing | A practical task |
|---|---|
| Days 1–7 | List income, essential outgoings and debt; complete a cash-flow stress test. |
| Days 8–30 | Review spending that can be cancelled, existing protection and expensive debt; business owners track overdue receipts. |
| Days 31–60 | Test a skill project or small business experiment against real employer or customer demand. |
| Days 61–90 | Use actual income, business contribution and cash receipts to decide the next quarter’s commitments. |
Macroeconomic data provide context; your own records guide action. Persistent household deficits call for an early review of spending and payment arrangements. Falling order contribution and slower collections call for a review of inventories and customer credit. Sustained improvements in income and contribution may support gradual increases in tested investments. None of these actions requires correctly predicting the economic turning point.
Planning a life involves more than spending less. Reduce duplicated, ineffective or unaffordable outgoings while making room within the budget for health, family relationships and long-term capabilities. Someone with stable earnings will have different priorities from someone already facing a shortfall. Time spent caring for children, older relatives and yourself is also a cost that belongs in the decision.
What changes have you noticed?
The same economic figures can be experienced differently across ages, occupations and households. Specific experiences are welcome, with room for disagreement. You can choose one of the questions below without sharing asset values, your employer, address or contact details.
- Over the past year, have the biggest changes been in your work income, business profit or household spending?
- What adjustment have you made in response to uncertainty that proved useful?
- If you could prioritise just one action over the next three months, what would it be?
About the material: statistics may be revised, and forecasts reflect each institution’s judgement at publication. Figures 1–3 redraw published data; Figure 4 and the business example are hypothetical illustrations. The personal planning suggestions are an analytical framework to use alongside your own records, contracts and local circumstances.
Sources & reading notes
Published statistics, institutional forecasts and the article’s analysis are distinguished in the text. Figures may be revised. Scenario examples illustrate a calculation, not a prediction or a uniform financial rule.
- NBS: China’s economic performance in the first three quarters of 2026 ↗2026-10-19
- NBS: China’s economic performance in October 2026 ↗2026-11-16
- NBS: Commentary on October 2026 consumer and producer prices ↗2026-11-09
- NBS: Industrial producer prices in October 2026 ↗2026-11-09
- NBS: Purchasing managers’ indices for October 2026 ↗2026-10-31
- NBS: Household income and consumption expenditure in the first three quarters of 2026 ↗2026-10-19
- IMF: Asia-Pacific Regional Economic Outlook, October 2026, Chapter 1 ↗2026-10-15
- OECD Economic Outlook, Interim Report September 2026 ↗2026-09-23
- ADB: Economic forecasts for China, September 2026 edition ↗2026-09-23
A question for the table
What changes have you noticed most over the past year, and what adjustments have helped? Share an experience without disclosing personal financial or contact details.